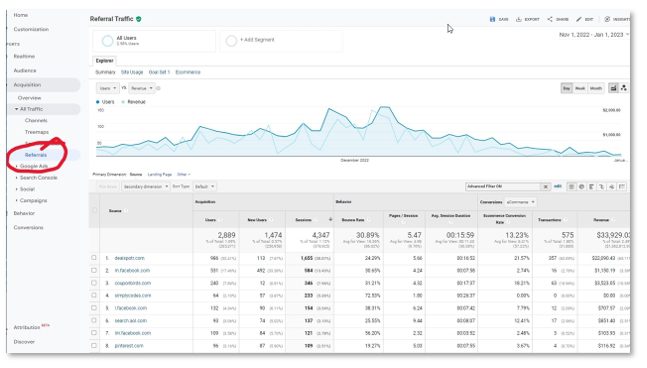
If you spend anytime analyzing data, exporting it to Excel, and adding formulas to get totals, you find quickly that certain Analytics metrics that appear to be a total at the top of a column are not a total at all. Wait, what?
Find the Story Behind the Analytics Stats

Some of these labels and metrics get a little tricky because of how they are defined by Google and by what happens with date ranges. Still, it’s more than just numbers. Hidden in those numbers is a STORY.
It’s critically important that we understand how these things work. But instead of detailing the definitions of Users, New Users, Visitors and Returning Visitors and how Google defines them, I want to focus on what those labels and numbers actually say. They are there so we can translate data into a relevant story for our customers.
Those of us who are math people (yes there are some humans who like math) can look at Analytics endlessly. You have an eCommerce client who does several million in sales and you can see your efforts showing up in their numbers. So there’s a story there.
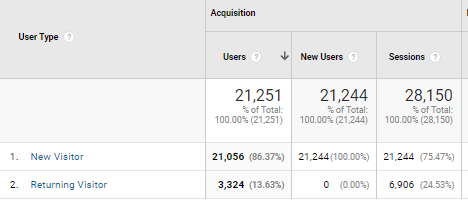
New Visitors Vs. Returning Visitors
Every client has new visitors and returning visitors. What is the relationship between those two metrics?
“Showing your client they are on page 1 because of something you did is not the story. They pay you to do that.”
Maybe a person visits a site for the first time via organic search. The next time the enter the site directly. This change is part of the story. If you’re doing SEO, so what if they are on page 1 of the SERPS for a non-branded term? What happens after a person clicks on the page 1 SERP is what matters. What happens if that person then comes back through Direct?
Showing your client they are on page 1 because of something you did is not the story. They pay you to do that. Figuring out why a visitor came back and what they did from there is far more important to your customer’s business goals than a page 1 SERP.
This is not to minimize our efforts as online marketing geniuses. But being a genius is not your client’s story. Showing your client’s increases and big numbers without a story is a feeble attempt to prove you’re valuable. Your being valuable is not part of the conversation they have with their higher-ups.
Context Matters
Should we be presenting numbers to clients? Yes, of course! But it must be within context. Don’t bury your customer with mountains of endless statistics and numbers.
“Your click thru rate is 5.87%!” And…? Are you trying to impress your client with your ability to do the job? They’re paying you, so yes, do a good job. But numbers in and of themselves don’t help a client. Analytics data tells a story. Your job is to convey that story. How you created, fixed and/or maintained the story is why they pay you – but that’s not the story.
If conversion rate has dropped, don’t avoid telling the client, find out why. And then give your client the narrative hidden in the data.
Google Analytics Story Example 1: Good
Recently I had a meeting with a client and showed them something significant I saw in Analytics. It was a new approach to acquire new members. When I told them what I saw in the numbers, it confirmed the effectiveness of their campaign.
“When I told them what I saw in the numbers, it confirmed the effectiveness of their campaign.”
When we try to keep it high-level, we may end up saying something kind of meaningless, like this: “Your total events tracked this month were 3,509, up 10% from last month.”
Instead I told them, “So this ‘New Members’ item, which must be some kind of link or clickable image, really jumped up quite a bit this past month. I haven’t seen this on the dashboard before. What are your thoughts?”
They were elated to find out their “New Members” campaign was working and thrilled that they had something of value to present to their higher-ups. I gave them a way to re-tell the story from the data. I didn’t even know about the campaign (because they didn’t tell me), but we detected it based on how we set up event tracking in GA.
Google Analytics Story Example 2: Not so Good
Then I had another client where I pointed out a spike without providing any relevant context (I didn’t tell the story). After the meeting we all went down a rabbit hole looking for a reason or a technical problem that didn’t exist. Like… “Hey I see you’re all wet.” Instead of digging a little deeper and finding the story. “Hey, you’re all wet, and it appears there is a hole in your umbrella.” Live and learn.
Give Them a Story to Tell
Yes, report the numbers. Google Analytics, paid search, dashboards all give us loads of numbers. Most people don’t like math so tell the story instead of firing off statistics. Find the story in those numbers and communicate more effectively with your customers.
Need help finding your GA story? Contact Us and get expert Google Analytics advice.