 Recent data compiled by Databox of the most-tracked metrics of over 50,000 Google Analytics users revealed that Google Analytics is most often called upon to:
- Measure and track visitor growth and online conversions.
- Determine how long visitors are staying on the site.
- What visitors are viewing.
This is critical information, but Google Analytics is capable of so much more. In this article we’ll share how to leverage the power of Google Analytics to gain more insight into visitor behavior and your website’s overall performance.
Make sure your data is in tip-top shape. Call us at (443) 475-0787 or Contact Us online to schedule a complete Google Analytics audit.
Understand The Buyer’s Journey
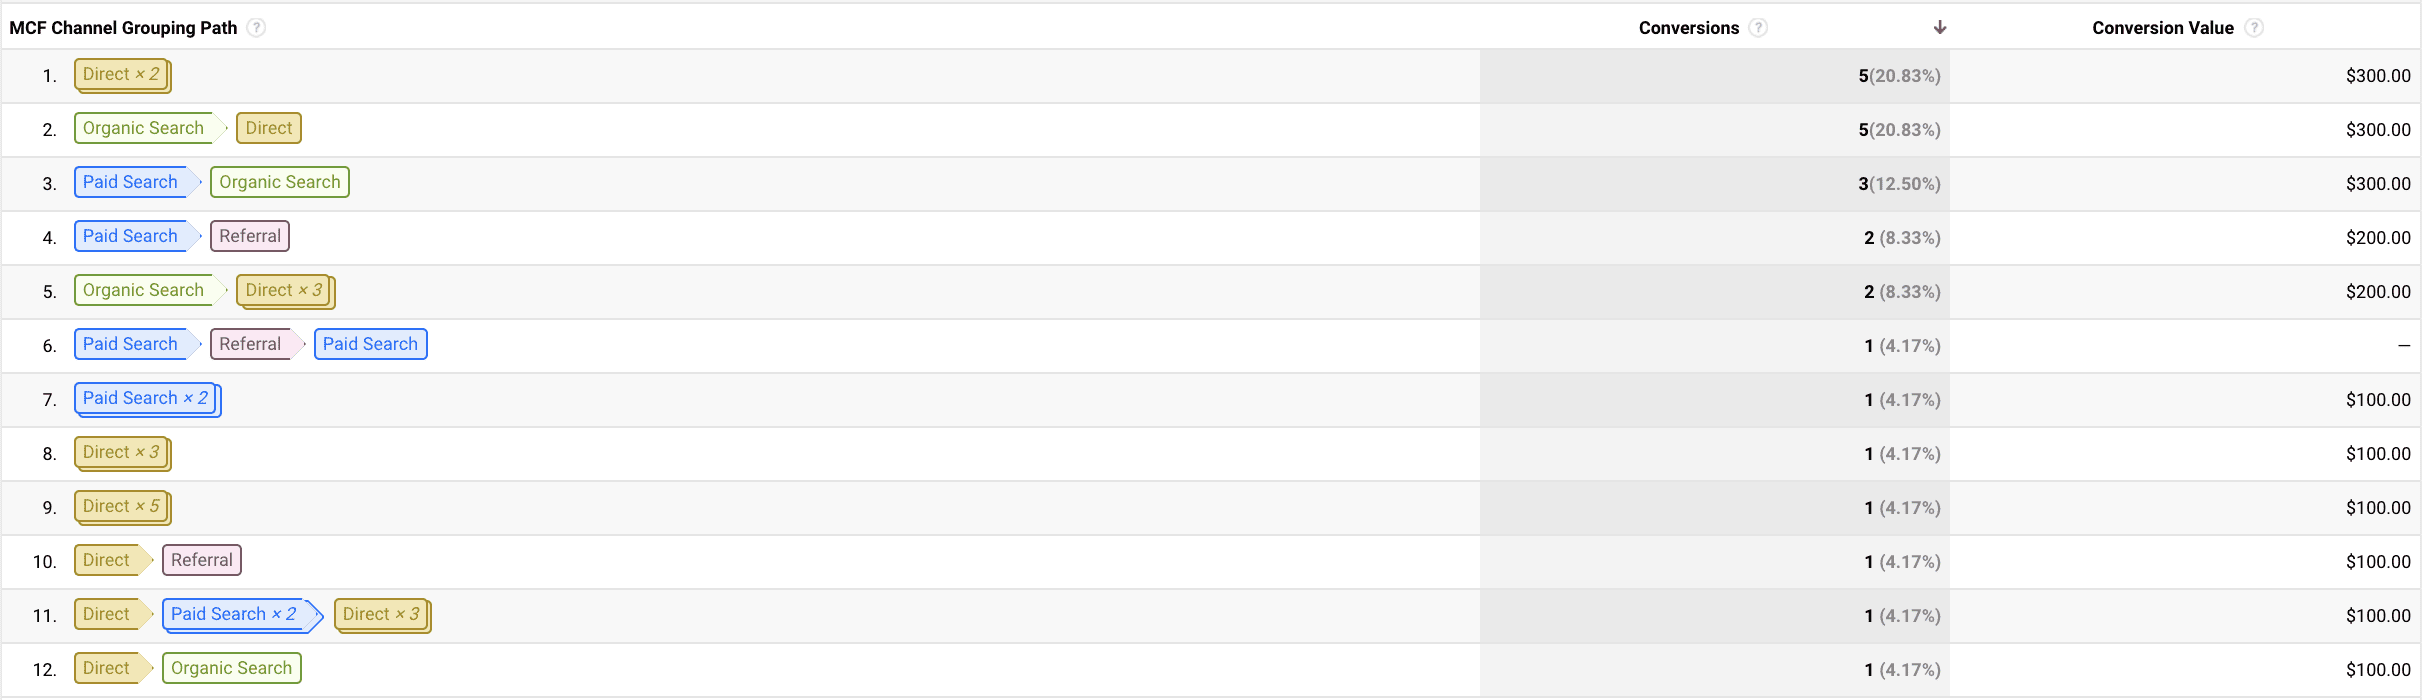
Do visitors convert upon their first visit to your site? We’re betting that many of them return several times, and perhaps even from different channels. By gaining a better understanding of how many times – and through what channels – a visitor returns to your site before converting, you’ll be better positioned to influence and encourage their actions (go to Conversions > Multi Channel Funnels > Top Conversion Paths).
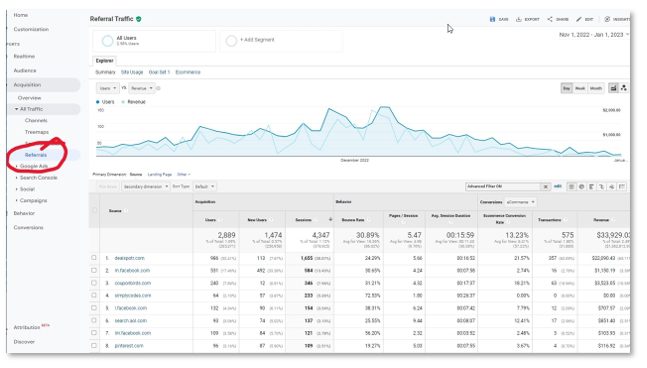
Understand How Visitors Navigate Through Your Site
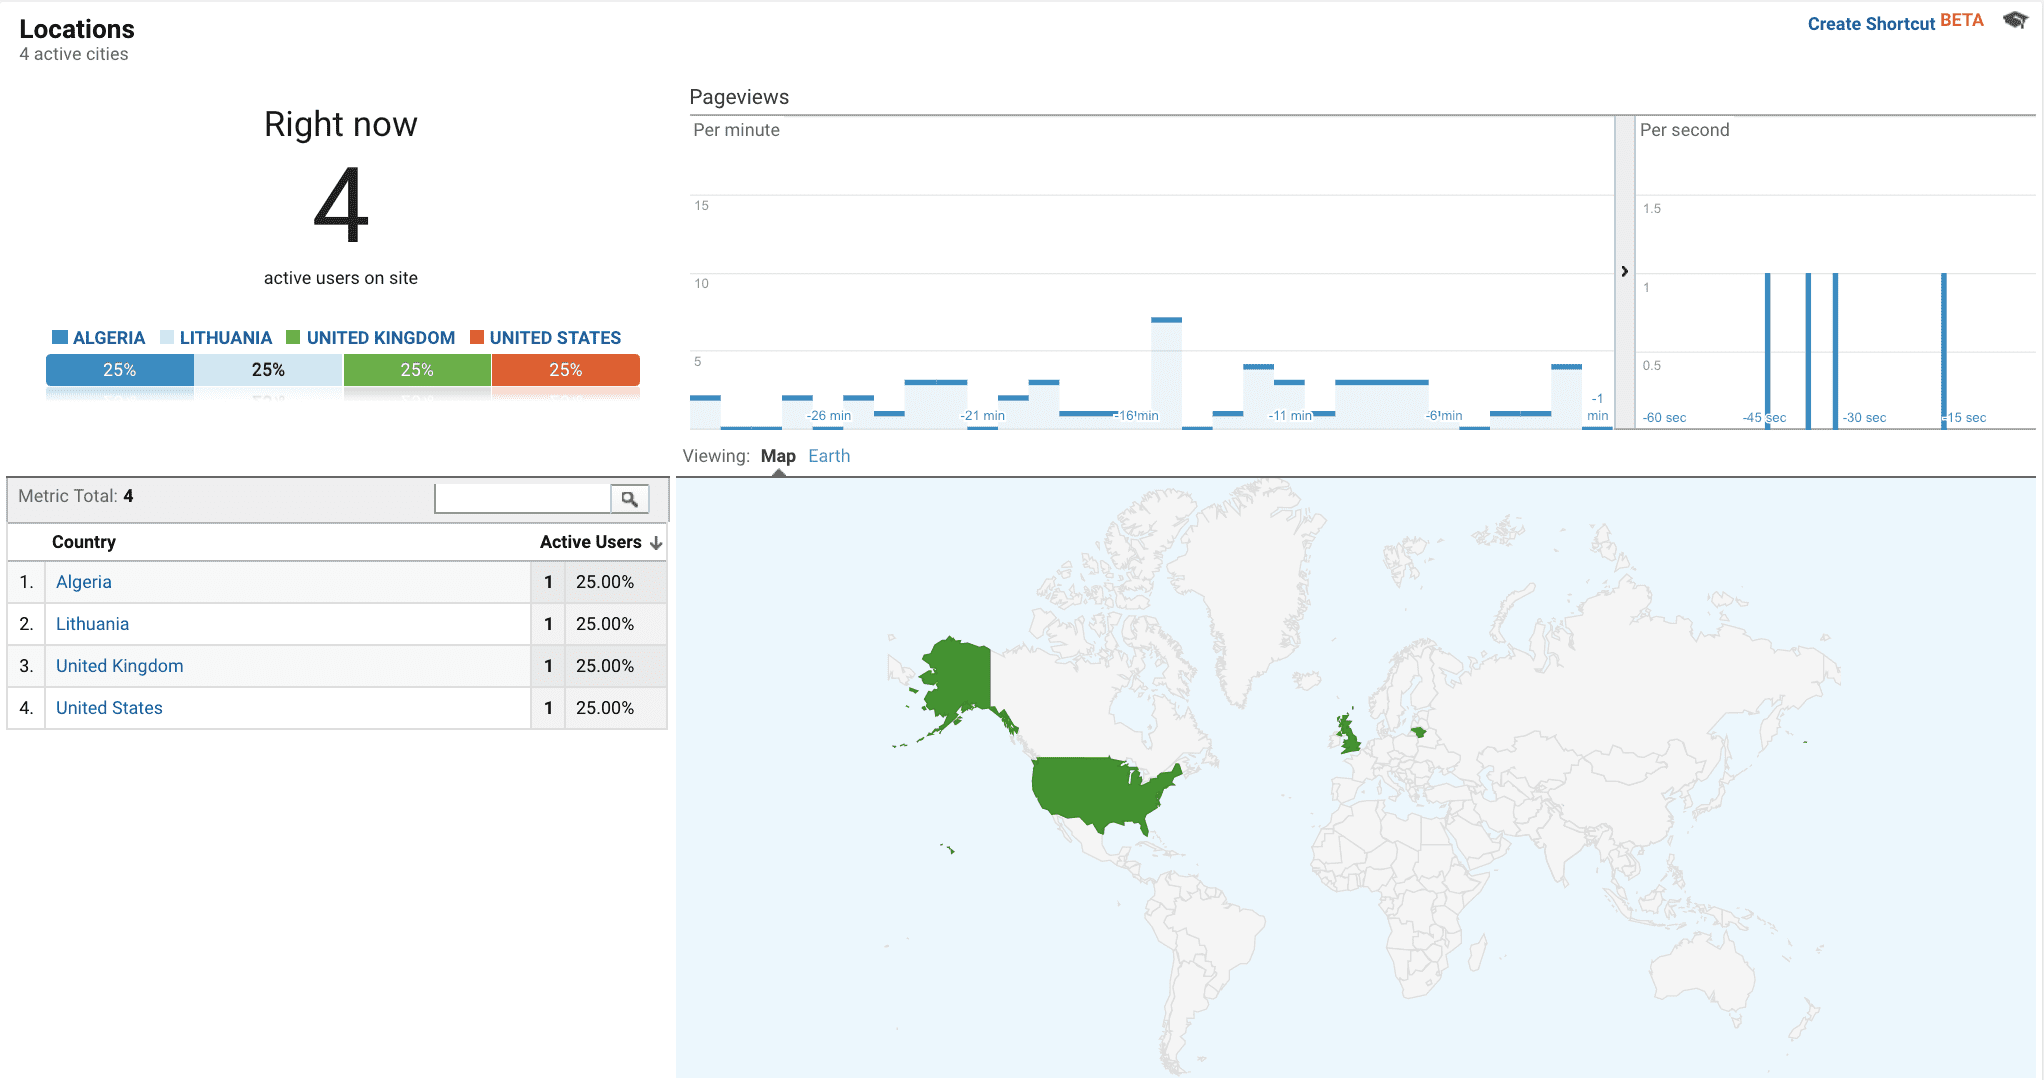
The Google Analytics Real-Time Reporting feature (go to Reports > Real-Time) provides a great overview of what’s happening on your site at any given moment. You can see firsthand how many users are currently active on your site, where they’re visiting from, what sources they were referred from and what pages they are viewing. This information tells you where you might want to add more content or change calls-to-action to influence future visitors. Real-Time Reporting is also useful for monitoring campaign performance. Keep in mind that Google Analytics recommends always using an unfiltered view when reviewing data in Real-Time.
Discover Which Companies Are Visiting Your Site
If you’re in the B2B space, it helps to know which companies visit your site. It’s against Google Analytics policy to collect personally identifiable information (PII) for your site’s visitors, but you may be able to glean some information through the Network Report. Many corporate visitors to your site will come through a general Internet Service Provider (ISP) such as Comcast or Verizon, but some will use a business branded network. To see this data, go to Audience > Technology > Network. For cleaner reporting, you might also consider setting up a filter (use “Service Provider” does not contain [name of ISP]) to remove the more common general ISPs.
Measure Metrics For Specific Groups
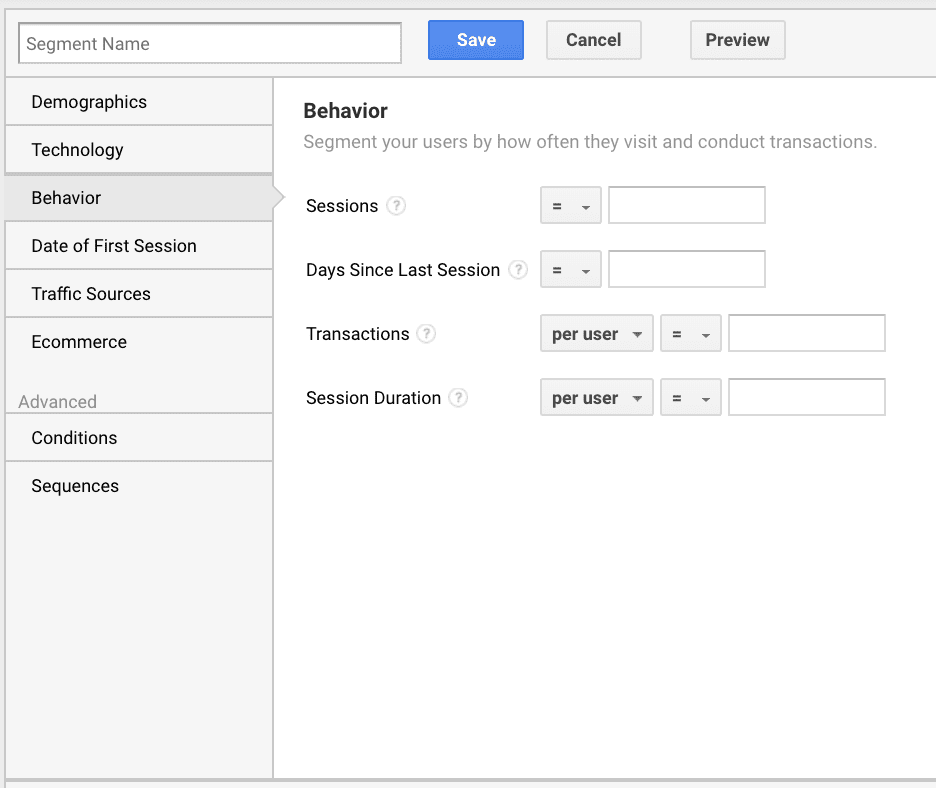
The Advanced Segments feature in Google Analytics enables you to isolate specific types of traffic. This can be useful for measuring engagement or reach for a specific audience. For example, let’s say your website promotes several service lines or product categories. It might be useful to create a segment called “Service A” for visitors who view a certain number of pages relevant to that service line. Or, you might define an “engaged” segment comprised of users who complete specific actions on your site and remain on the site for a particular amount of time. To set up an Advanced Segment, go to Audience > Overview and click on “All Users”. This will bring you to your list of segments. Click the red “+ New Segment”, and select the desired criteria. Once your segment is saved in this list, just navigate back to this screen, check the box next to the segment name and select “Apply” to see reporting for this segment for a desired timeframe.
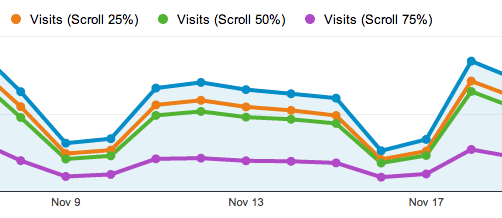
Determine How Much Of The Page Visitors Are Reading
How much of your content do visitors read and where do they fall off the page? Heat map plug-ins can be helpful for gathering this information, but they may be costly and unnecessarily complex. One solution is to set up scroll depth tracking to determine an approximate percentage of the page visitors are viewing. This can help you decide if your content is spot on, if it lacks relevancy or is too long. Distilled details how to set up scroll depth tracking using Google Tag Manager. Another solution is to use a Scroll Depth plug-in for Google Analytics.
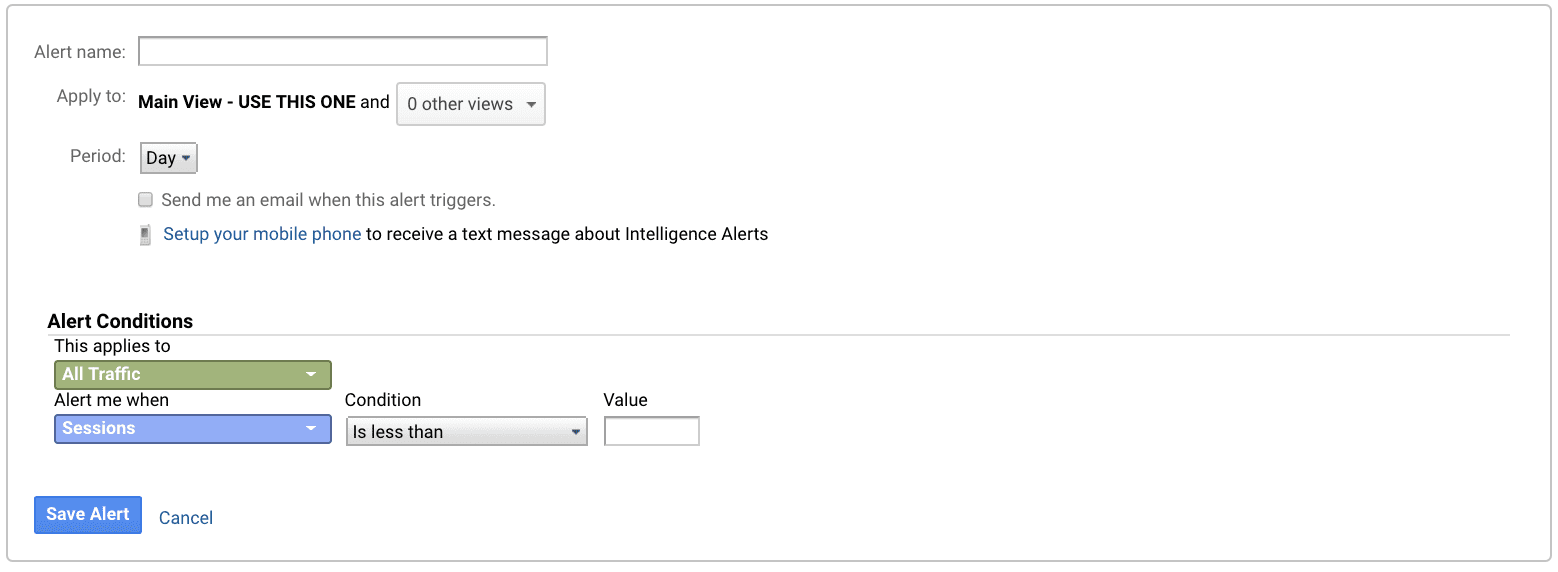
Get Alerted To Unusual Website Activity
Wouldn’t it be helpful to get an email or text alerting you to check out a drop in organic or e-commerce sessions, an increase in 404 “not found” page views or a surge in suspect (spam) referral visits? Simply go to Admin > Personal Tools & Assets > Custom Alerts to set this up. Select “+ New Alert”, and select the desired criteria. Here’s a list of custom alerts from SEMrush that are particularly useful for digital marketers.
Utilize Google Analytics to its full potential. Call us at (443) 475-0787 or Contact Us online and start collecting the data that’s most useful to inform your marketing strategy.