![]() Google Analytics is rolling out Cross Device capabilities to help companies better understand the customer journey. Prior to Cross Device reporting, if a user came to your site from a mobile device and then from desktop, it would show as two separate sessions and two unique users. With the new Cross Device feature, you’ll be able to see when users visit your site from different devices. You’ll also be able to better understand the customer path, have more accurate data for conversions per user and can use this information to positively influence engagement and conversions.
Google Analytics is rolling out Cross Device capabilities to help companies better understand the customer journey. Prior to Cross Device reporting, if a user came to your site from a mobile device and then from desktop, it would show as two separate sessions and two unique users. With the new Cross Device feature, you’ll be able to see when users visit your site from different devices. You’ll also be able to better understand the customer path, have more accurate data for conversions per user and can use this information to positively influence engagement and conversions.
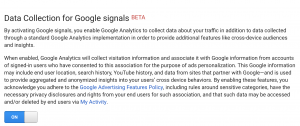
Google is gradually rolling out the cross device reporting to all users, so if you don’t have access yet you should within the next few weeks. To activate the new feature, go to Admin > Property Settings > Tracking Info > Data Collection. Then, under “Data Collection for Google signals” set the toggle button to “on” as shown below and click “Activate”.
When you enable Google signals, Google will start automatically collecting additional data about your traffic. It’s important to note that the Cross Device reporting will include only aggregated and anonymized data from users who have opted in to personalized advertising. Unfortunately, there’s no hard data from Google right now as to what percentage of users have opted in.
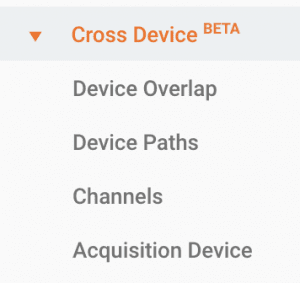
To view the reports, go to Audience > Cross Device. Note, that you probably won’t see anything right away – a sufficient amount of data needs be collected before Google Analytics can generate the reports.There are actually four individual reports, as shown below.
- Device Overlap shows users by device category (mobile, tablet, desktop), illustrates the overlap in a Venn diagram format and contains a table which shows users, sessions and conversions according to different user path combinations (e.g. mobile followed by desktop, tablet followed by mobile followed by tablet again, etc.).
- Device Paths shows the same path combination table included under Device Overlap, but also includes the extra metric of average session duration. In addition to device, you can also display the path information to include campaign, channel, medium, source and operating system.
- Channels shows a table consisting of acquisition, behavior and conversion metrics by channel.
- Acquisition Device shows new users by device category and also illustrates this data over time. This report also includes the same table as that shown under Device Path, except that the data only pertains to new users.
Utilize Google Analytics to its full potential. Call 443.475.07787 or contact us today to leverage visitor data to inform your marketing strategy.


