 The amount of data that is collected and stored in Google Analytics can be overwhelming. If your organization is struggling to really get value from this tool, then you might consider setting up a Google Analytics dashboard. A dashboard will allow you to track and view the data that is most relevant to your company. You’ll be able to view your key metrics at a glance for any time period you choose. You can create your own, custom dashboard but there are also many free dashboard templates that are readily available.
To get started, login to Google Analytics, click dashboards, then + Add New. In this post, we share our favorites – the dashboards we install on our client’s GA accounts. Keep reading to find the best Content Marketing Dashboard, Small Business Dashboard, Social Media Dashboard, Organic Monitoring (SEO) Dashboard, and Personal Blogger Dashboard.
Content Marketing Dashboard
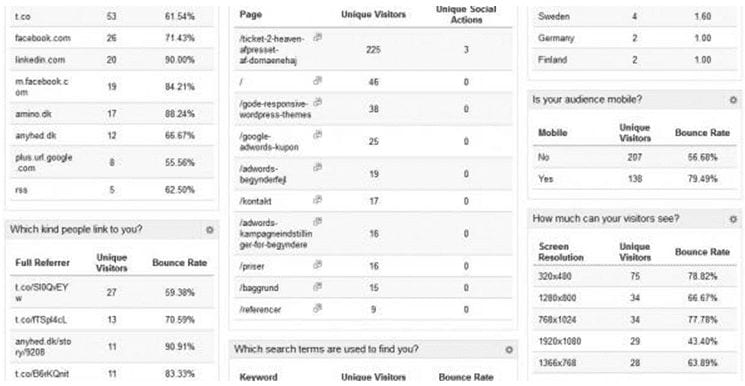
We’re not shy. We’ll share one of ours first. Created by your friends here at periscopeUP, this dashboard shows the results of your content marketing efforts. The left column shows how people are finding your stuff; the center column shows what’s most popular; and the right column shows what’s working (what content is actually contributing to leads and sales). Click here to install the Content Marketing Dashboard.
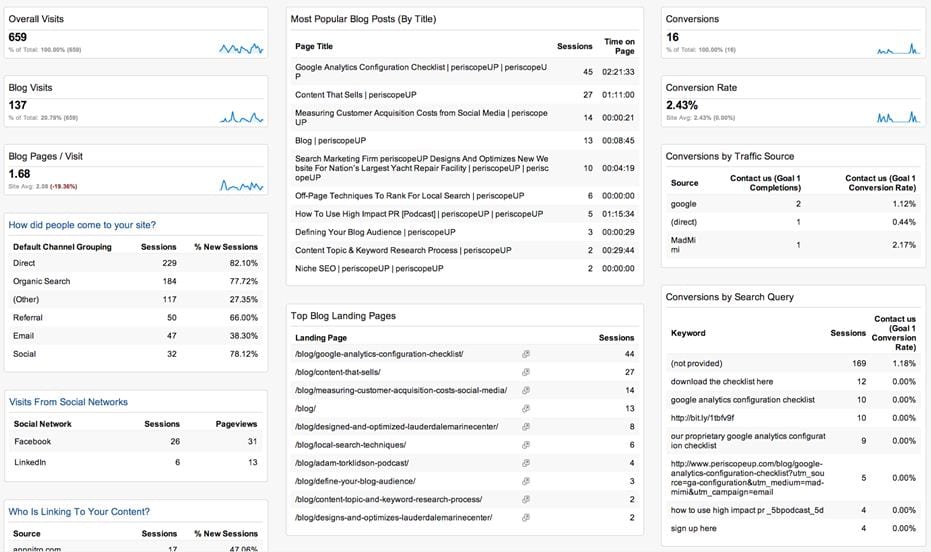
periscopeUP’s Content Marketing Dashboard helps you determine what content is contributing to leads and sales.
Small Business Dashboard
Courtesy of Google, this dashboard provides basic small business website data. A great start from which you can customize your own dashboard. Click here to install the Small Business Dashboard.
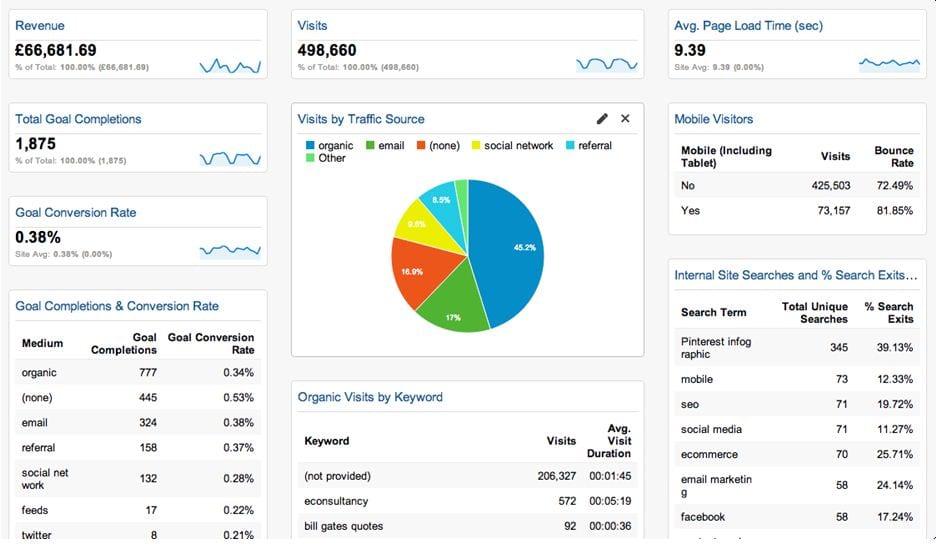
The Small Business Dashboard was developed by Google and can be a good dashboard to customize..
Social Media Dashboard
Courtesy of the Google Analytics Evangelist, Justin Cutroni (follow him if you don’t already on Twitter or Google+), this is the best social media dashboard we’ve found because it ties social activities to outcomes and will help you track the effectiveness of social campaigns. Click here to install the Social Media Dashboard.
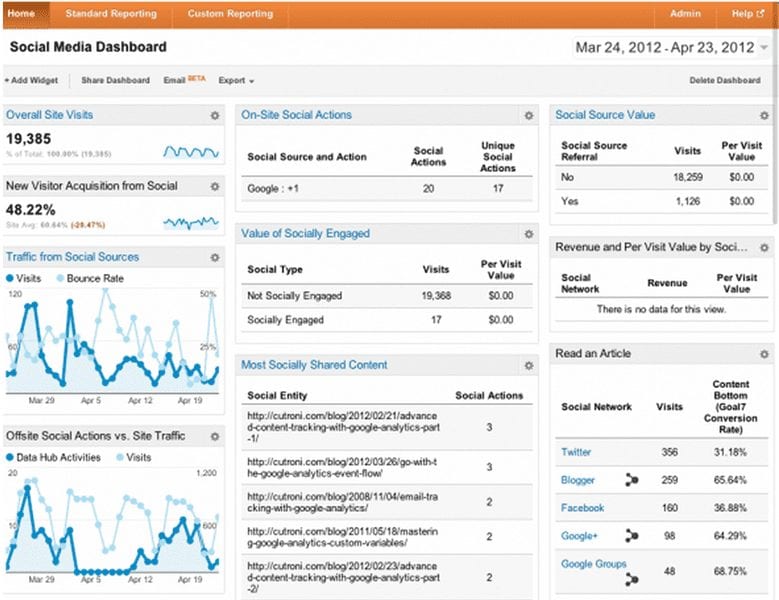
The Social Media Dashboard by Justin Cutroni..
Organic Monitoring Dashboard
Courtesy of eConsultancy, this dashboard provides an array of organic search (SEO) and keyword data. Note that it only uses keywords Google shares with us. Click here to install the Organic Monitoring Dashboard.
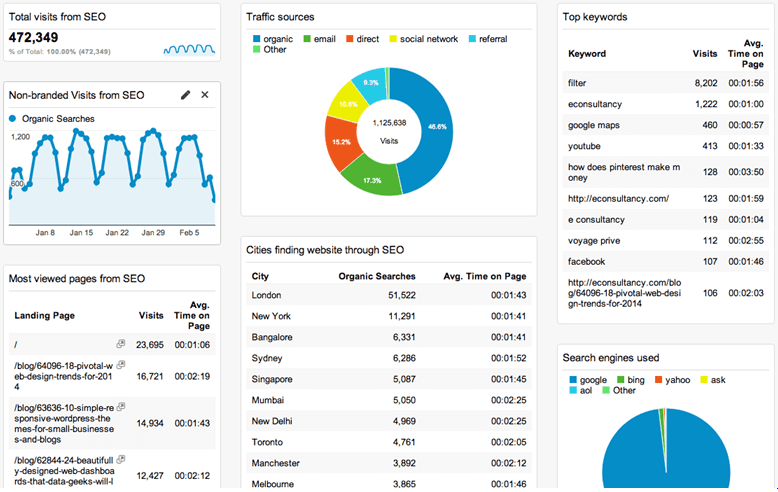
The Organic Monitoring Dashboard helps with your SEO.
Personal Blogger Dashboard
This dashboard, by Dashboard Junkie, is useful if you blog a lot. What we like about it is that the headers use plain English (How did users find your site) instead of marketing jargon (traffic source). Great for active bloggers. Download the Personal Blogger Dashboard here.
The Personal Blogger Dashboard uses plain English, not industry jargon.
Ecommerce Dashboard
This dashboard, by Blast Analytics & Marketing, examines customer acquisition, purchasing habits and product revenue to provide important data for product offering decisions.
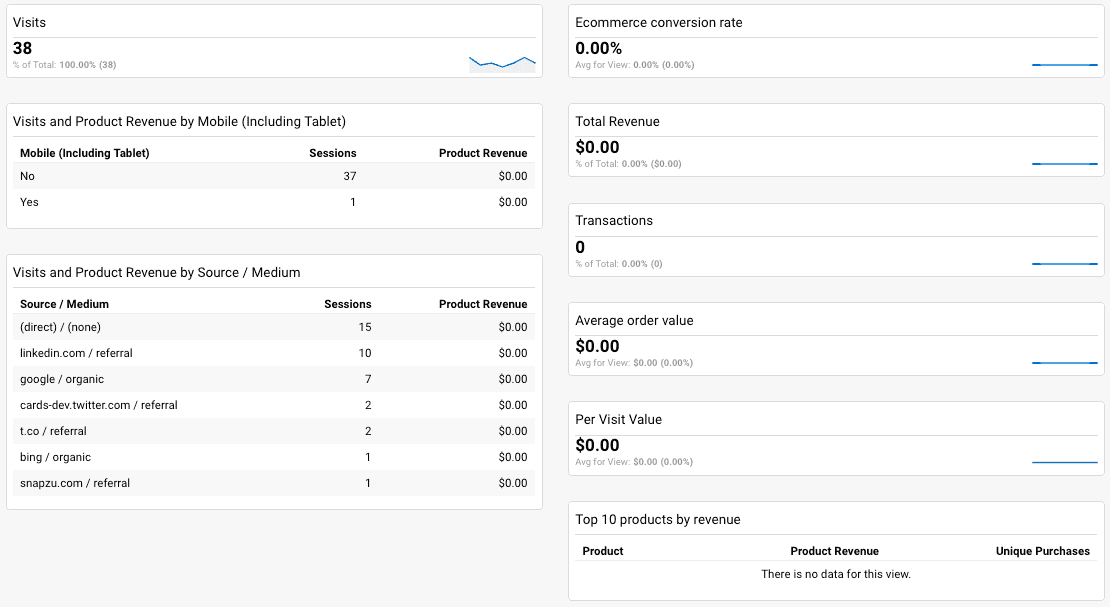 The Ecommerce Dashboard helps with your product strategy.
Page Timing Dashboard
This dashboard, by Site Diagnostics, provides insights into technical issues that may need to be addressed. By switching from the Data table view to the comparison table view you can compare load time to bounce rate and also compare the bounce rate for individual pages to the site average.
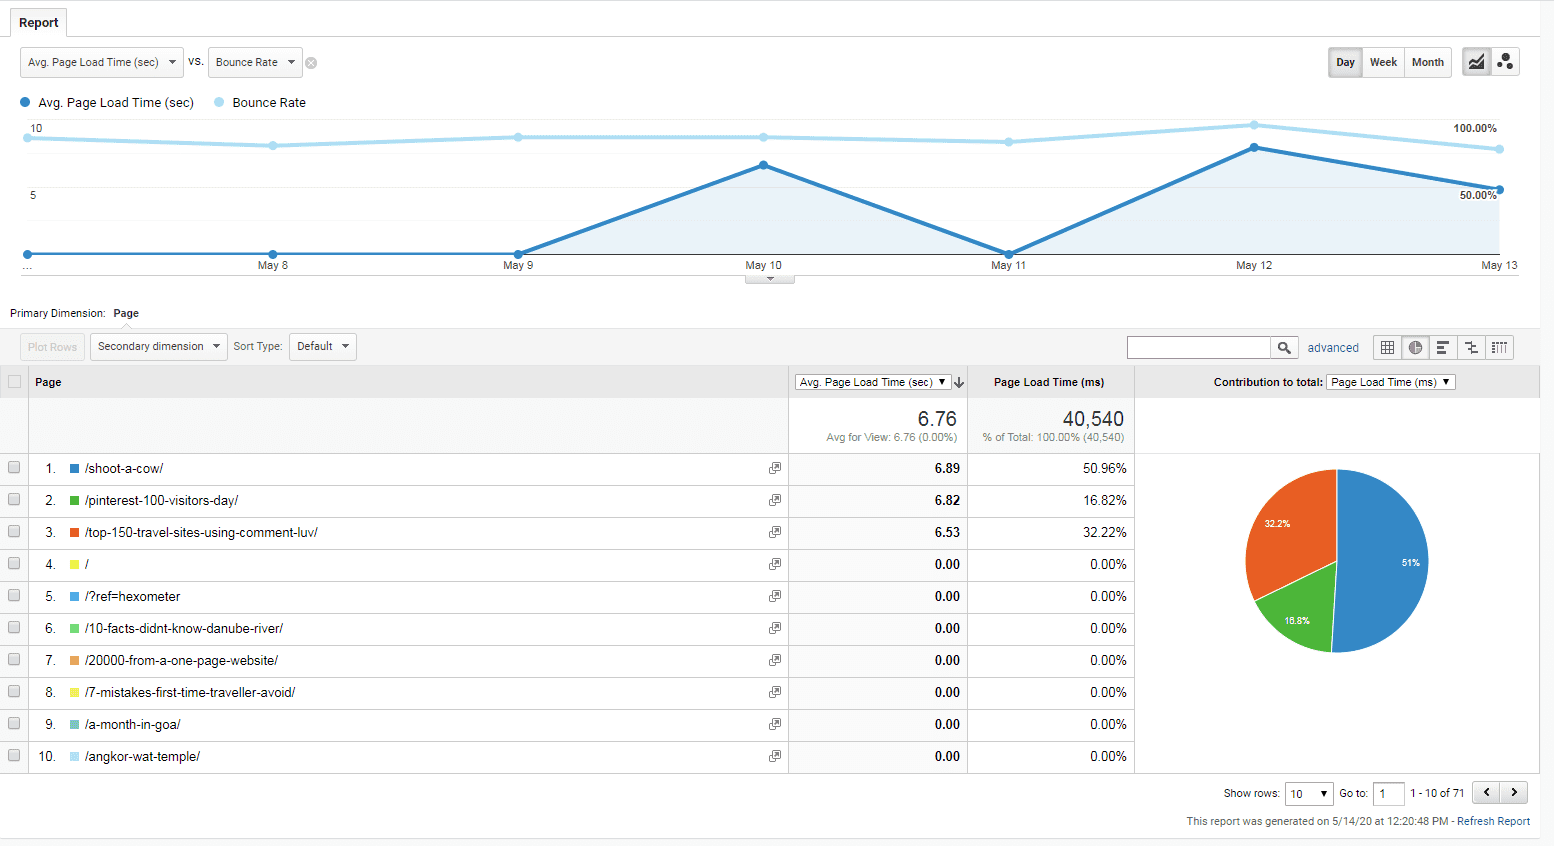 The Page Timing Dashboard helps improve user experience.
Mobile Dashboard
This dashboard, contributed by Andrew Faulkner, provides detailed information on mobile visitor devices, operating systems and screen resolutions alongside actions those visitors are taking on your website.
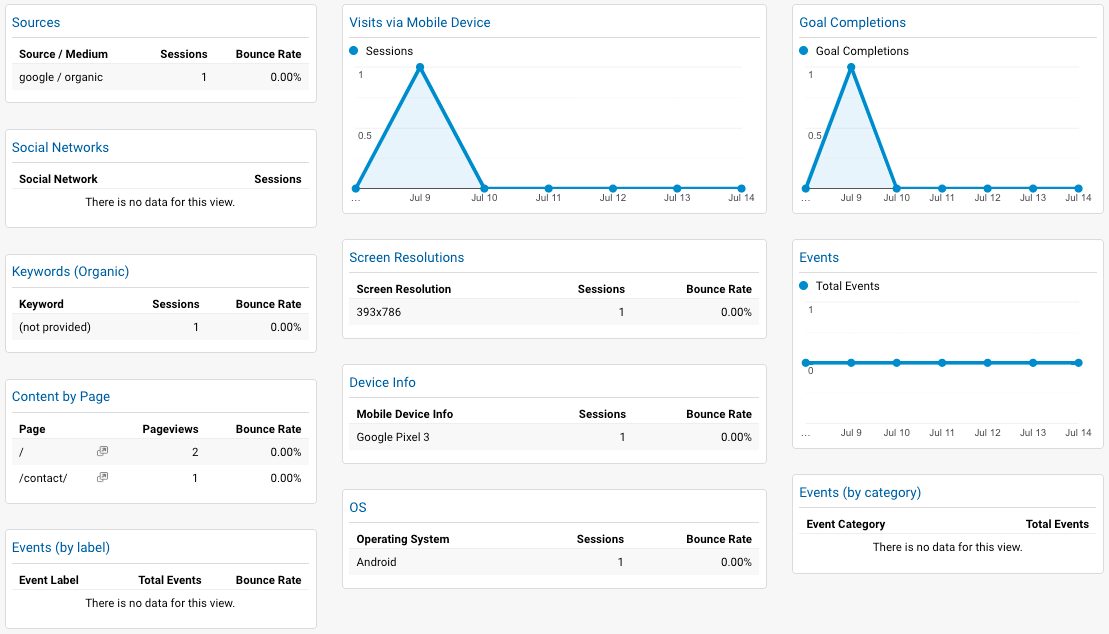 The Mobile Dashboard helps monitor and evaluate mobile user experience and performance.
Email Marketing Dashboard
Courtesy of Klipfolio, this dashboard tracks the quality of leads on your email list and also reports on bounce rate, sign-ups, unsubscribes, open rate, click-through rate and engagement.
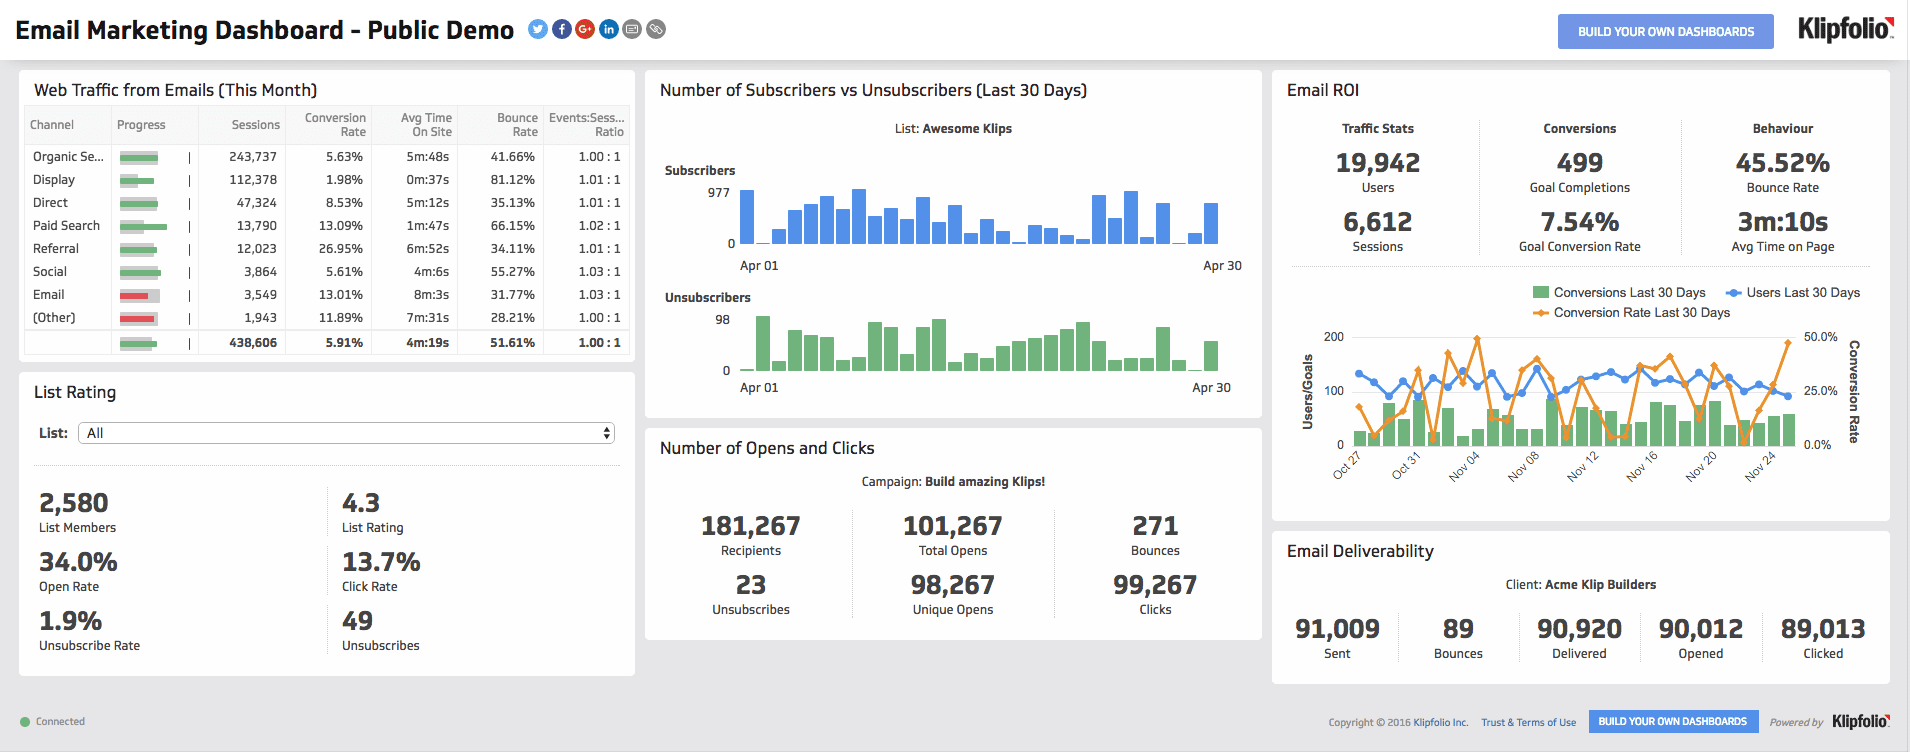 The Email Marketing Dashboard helps monitor email performance and engagement.
That’s it: our favorite Google Analytics dashboards. If you know others we should try out, let us know.
Need Help Implementing Your Google Analytics?
We offer fixed price packages to implement and configure Google Analytics. We’ll even tell you where your website’s opportunity is and how to reach your online goals.